Microsoft Excel Spreadsheet Project
Using MS Spreadsheet for Data Analysis & Data Visualization
Technical Implementation
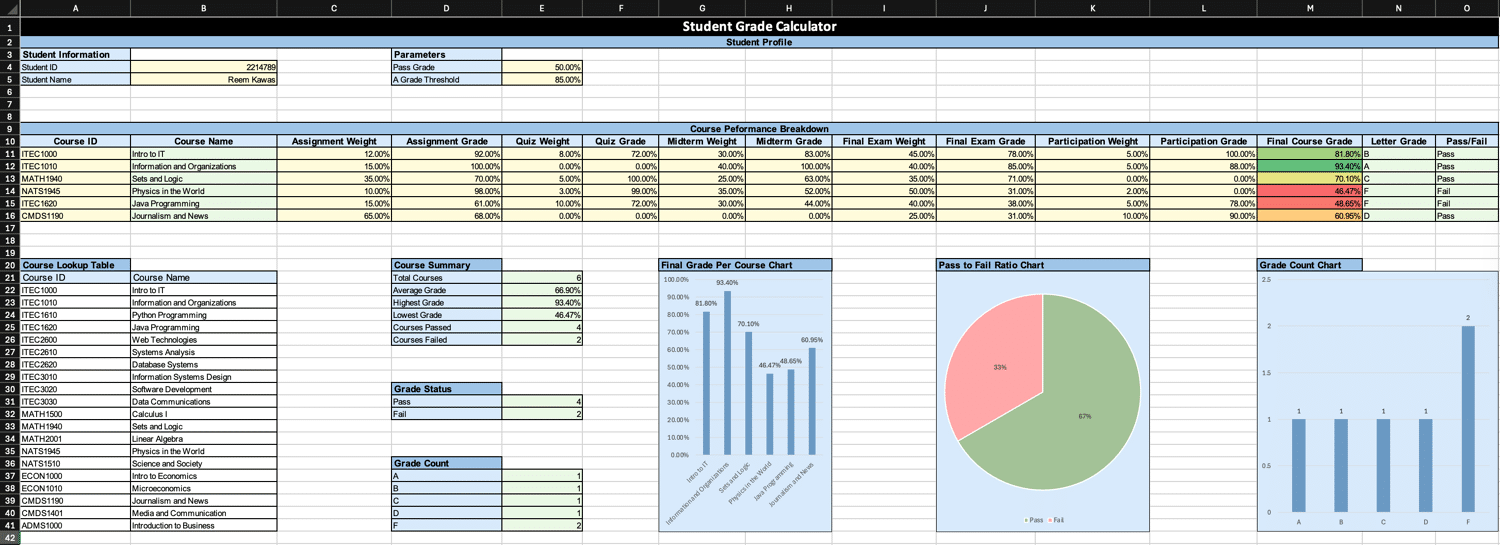
This project demonstrates an Excel solution that uses advanced formulas to simplify data analysis while keeping the layout clean and organized.
The project uses VLOOKUP to connect and compare data across tables, colour coding to highlight input/output cells, charts to visually represent data, and parameters to switch between views without changing the main data.